Web Pages
This section documents the web-based user interfaces available in Watcher.
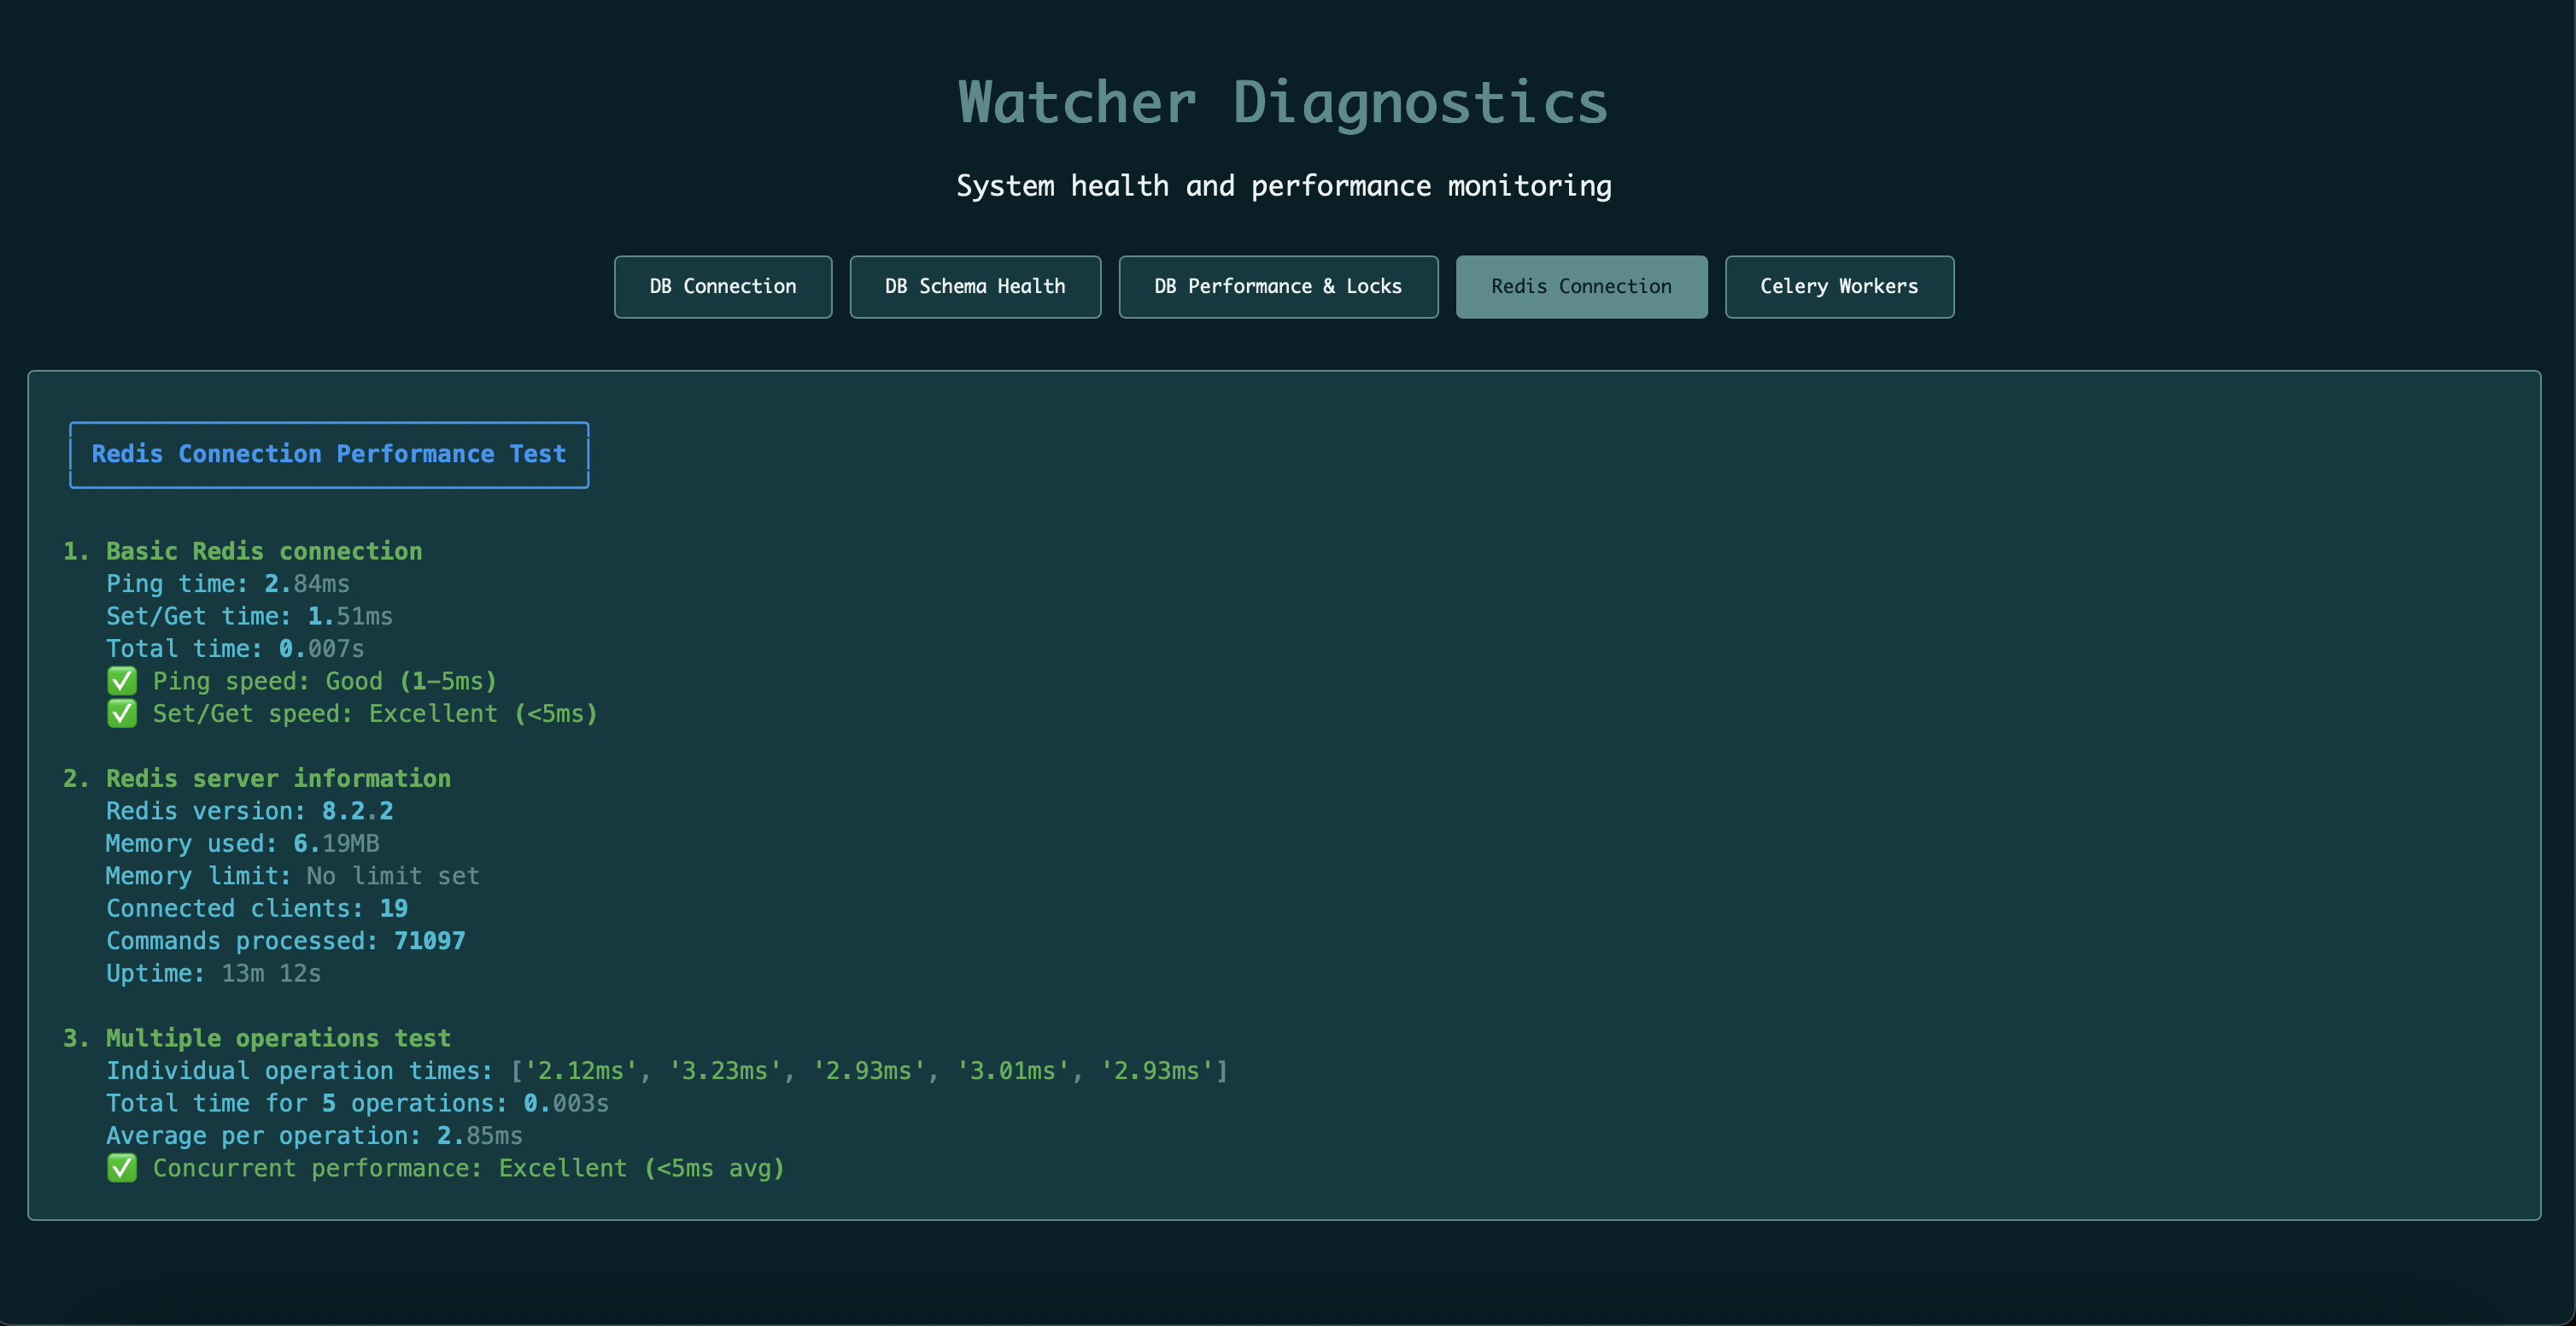
Diagnostics Web Page
URL: http://localhost:8000/diagnostics
Web-based diagnostics interface providing system health monitoring and performance analysis.
Features:
Database health and connection performance testing
Schema health checks and index usage statistics
Celery worker status and task performance monitoring
Redis connection health and performance metrics
Deadlock statistics and active query analysis
Long-running query identification
Real-time system metrics
Sections:
DB Connection - Raw asyncpg connection performance testing and direct database connectivity validation
DB Schema Health - Table sizes, row counts, index usage statistics, missing indexes identification, unused indexes detection, and table statistics
DB Performance & Locks - Deadlock statistics and trends, currently locked tables, top active queries with duration and wait events, and long-running queries (>30s) identification
Celery Workers - Worker status, task performance, queue monitoring, and background task diagnostics
Queue Analysis - Detailed breakdown of queued tasks by type with counts and percentages
Redis Connection - Redis server health, memory usage, connection performance, and server information
Example:
Lineage Graph Web Page
URL: http://localhost:8000/lineage-graph
Web-based interactive lineage graph providing visual representation of data flow relationships between addresses.
Features:
Interactive graph visualization with drag-and-drop nodes
Hierarchical layout based on data flow depth from selected address
Advanced filtering by target address, direction (upstream/downstream), and depth
Real-time graph updates when filters change
Pipeline information display on edge hover
Click-to-navigate functionality for changing center address
Address search with autocomplete suggestions
Usage:
Select Address: Choose a source address from the dropdown to center the graph
Search Address: Type in the search box to find addresses with autocomplete suggestions
Filter by Target: Select a specific target address to show only paths to that address
Direction Filter: Choose “Upstream” to see data sources, “Downstream” to see data targets, or “Both”
Depth Filter: Limit the graph to show only relationships within a certain depth (default: 2)
Interactive Navigation: Click on nodes to change the center address and reload the graph
Graph Layout:
The graph uses a hierarchical layout algorithm that:
Centers the graph around your selected address
Positions nodes based on their depth from the center
Arranges nodes horizontally by depth level
Vertically distributes nodes at the same depth level
Visual Elements:
Nodes: Represent addresses with different colors for the selected address (red) and others (blue)
Edges: Show relationships between addresses with pipeline information on hover
Pipeline Details: Hover over edges to see pipeline name, type, status, and metadata
Interactive: Drag nodes to reposition, click to change center address
Data Source:
Built on the
lineage_graph_reportmaterialized view for fast query performance.Example:

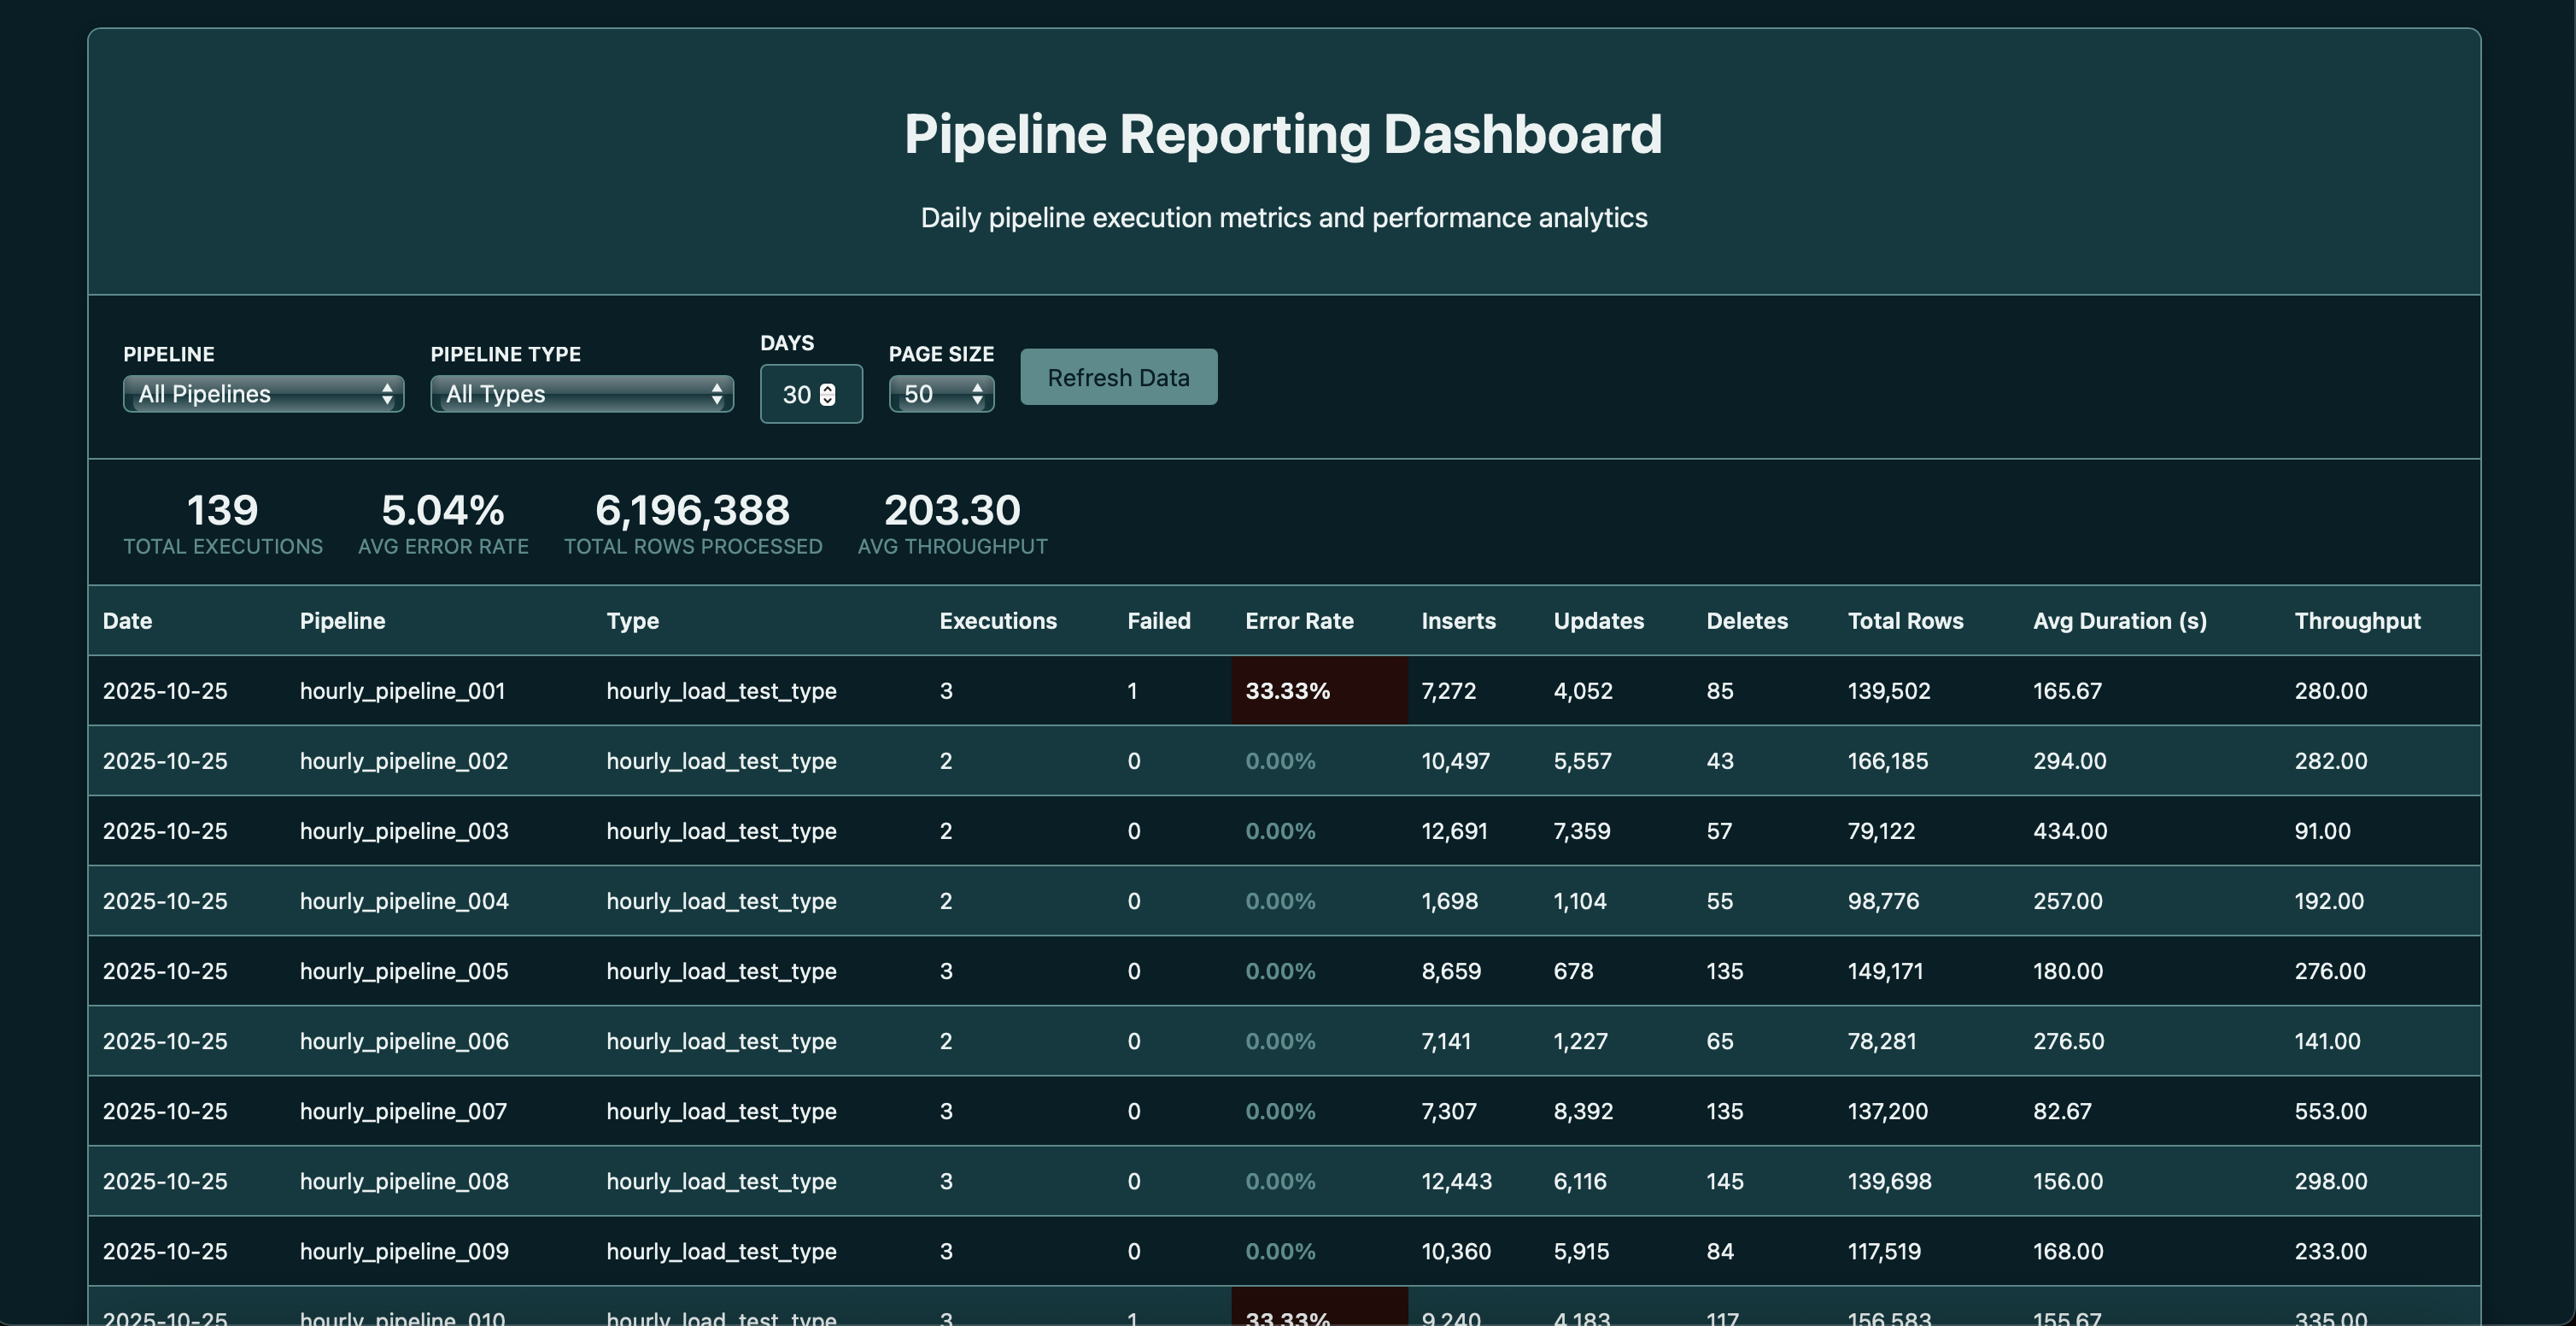
Reporting Dashboard Web Page
URL: http://localhost:8000/reporting
Web-based reporting dashboard providing daily pipeline performance metrics and analytics.
Features:
Daily aggregations of pipeline execution data
Performance metrics (throughput, duration, error rates)
Pipeline type and name filtering
Time range filtering (last 1-30 days)
Real-time data from materialized views
Auto-refresh capabilities
Data Source:
Built on the
daily_pipeline_reportmaterialized view for fast query performance.Example:
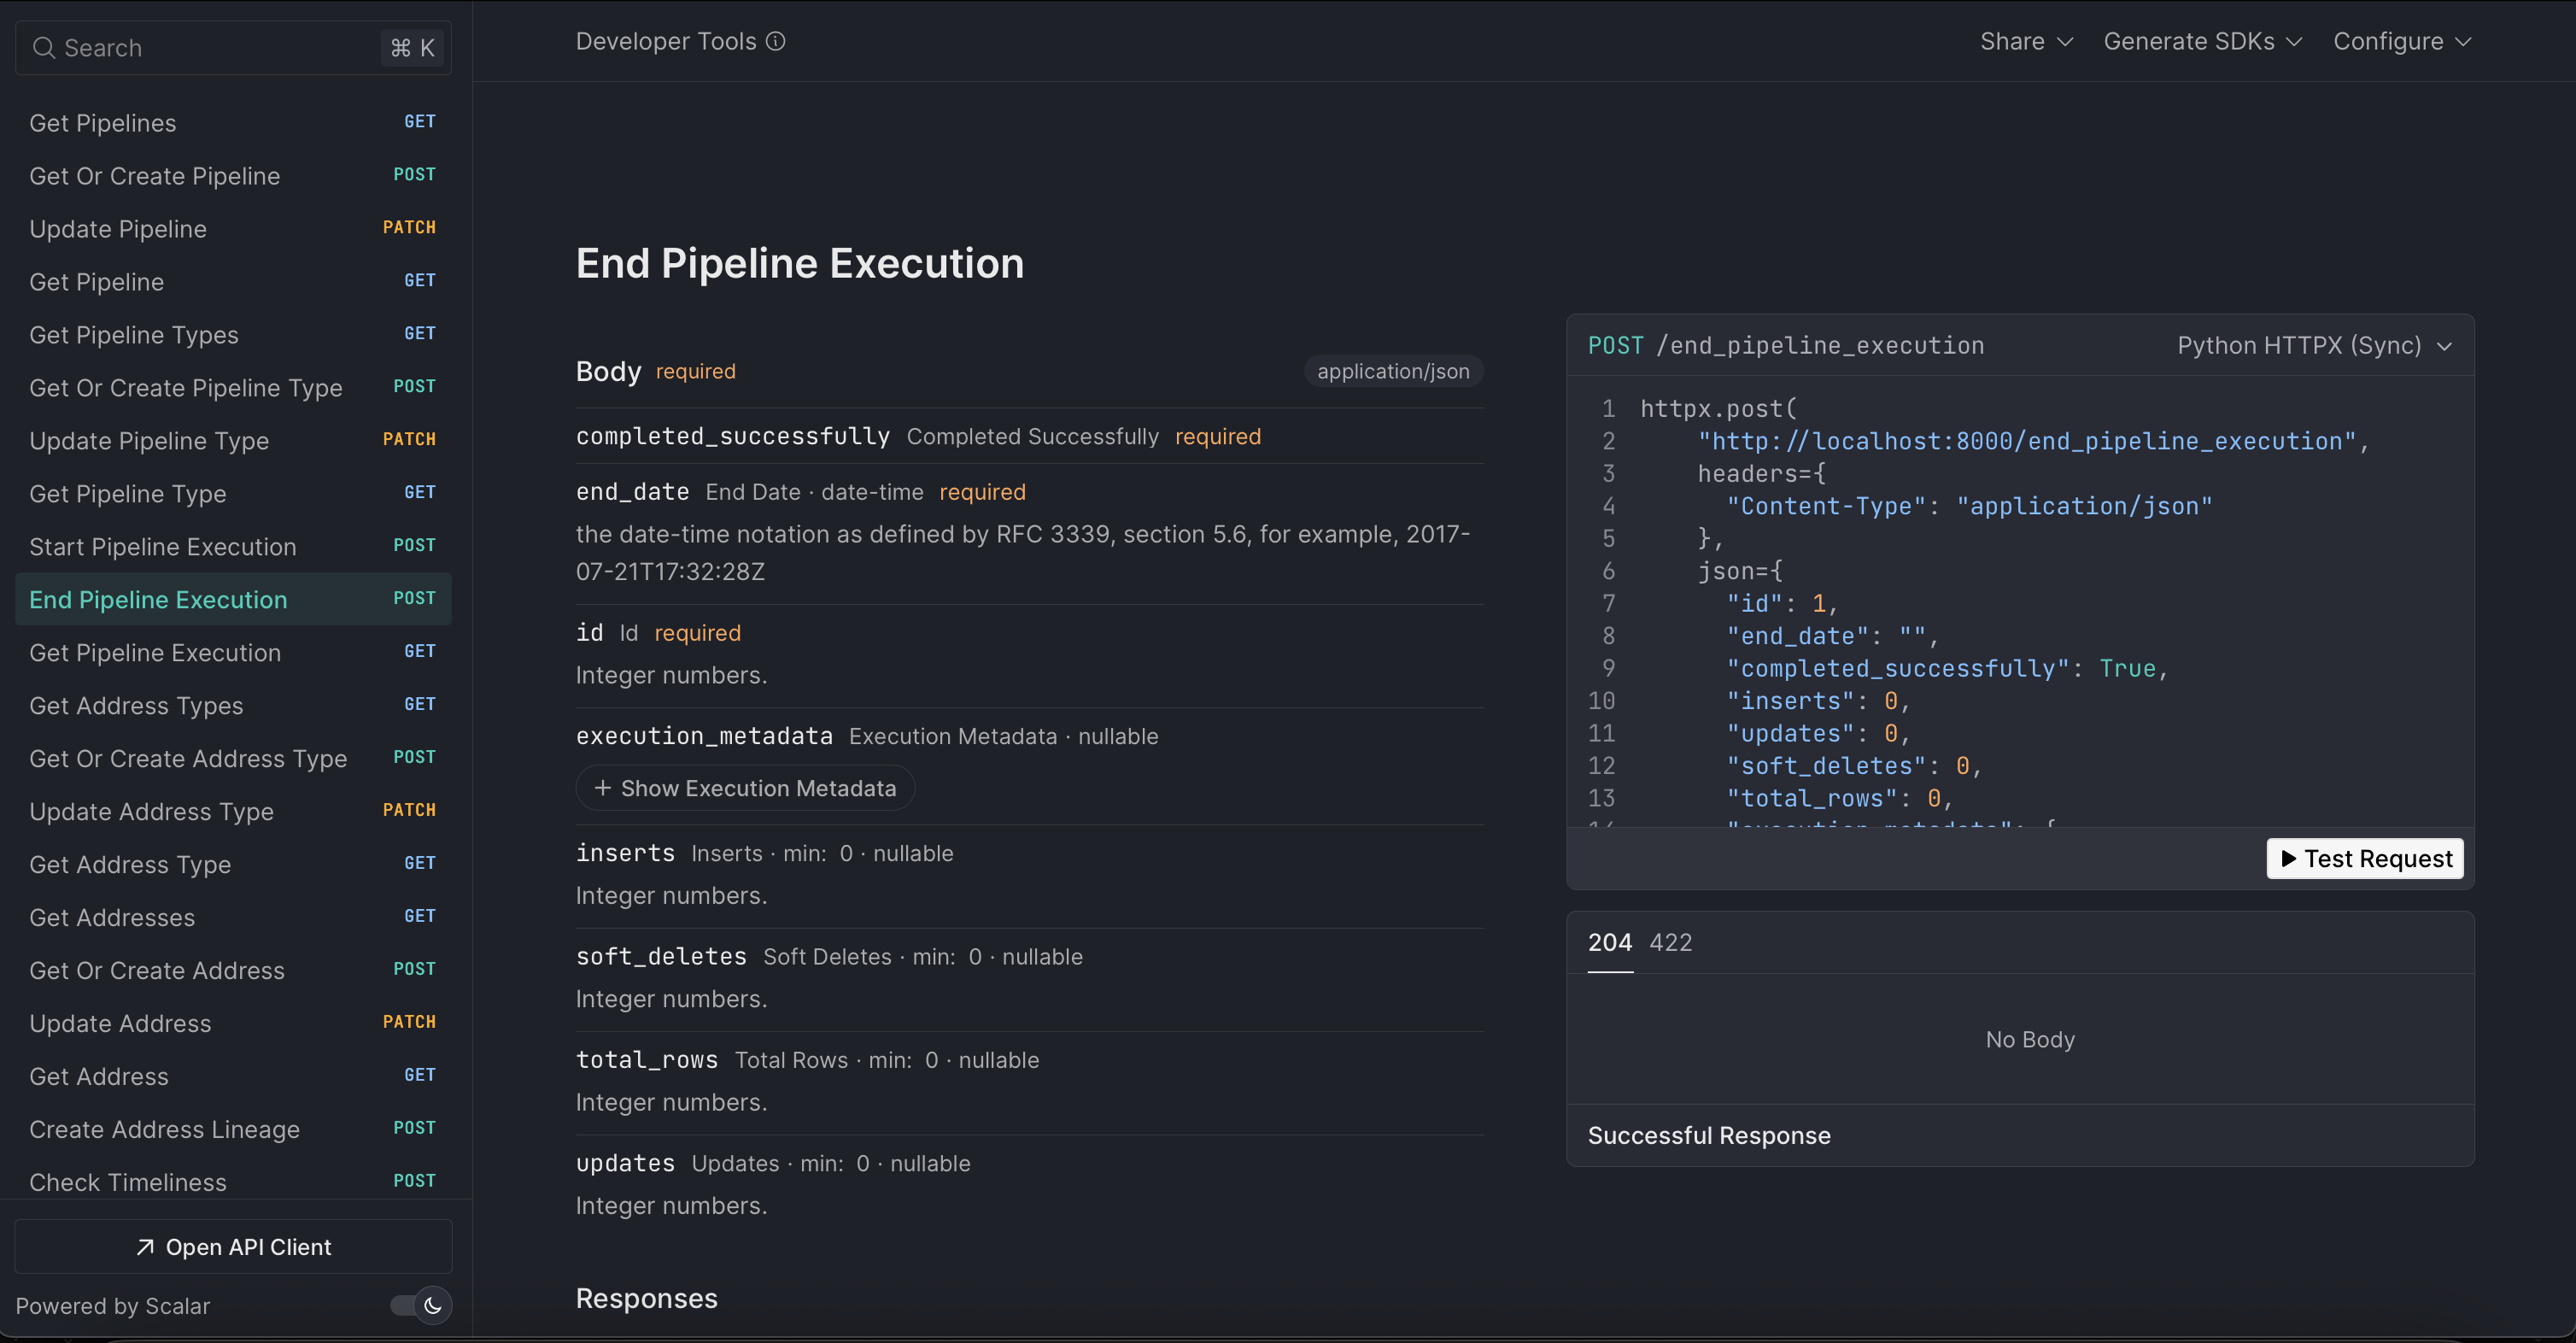
Interactive API Documentation
URL: http://localhost:8000/scalar
Interactive API documentation using Scalar for an intuitive interface to explore and test all available endpoints.
Example: